Motivators Update - October 2020
Posted 10/22/2020
At Assessments 24x7 we are always working to ensure that our information is current and relevant. To that end, we recently reviewed
our Motivators population and reports to be sure you are getting the BEST products available! We are excited to announce a few
updates to our Motivators report coming in the next week.
What’s changing?
- New Population-based Norms
The most important update is new population norming! The last time we provided norm numbers, we had just over 30,000 Assessments 24x7 users included in our pool. We now have over 749,000 users to create our data! You’ll notice in the reporting a shift in our median norm numbers for each dimension and a slight adjustment to our shaded boxes (both the grey box plot and the colored box). While the scores didn’t shift dramatically, even with a MUCH larger population, there are some changes that will impact the ways the graphs look. - Update to the Motivators Graph
Your individual graph has changed slightly, based on the new population scores. The white line is the median, grey box is average, the colored box is the majority of the population, and shows 2 standard deviations from the median.
If your score falls in the grey box, your score is average. If your score falls in the color-shaded box you are like most of the population, and within 2 standard deviations and therefore, not extreme in your Motivator. If your score is in the white space either to the right or left of the color-shaded box, you are more intense in those motivators, whether high or low. - Updated Word Matrix Page
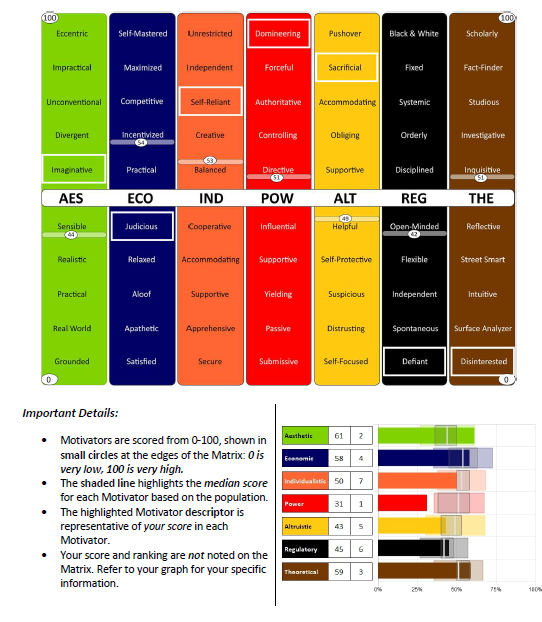
The Word Matrix has been modified to include some visual elements to make it more straightforward and user-friendly. You’ll notice the Dimension names have moved to the middle of the Word Matrix, a “0” and “100” score bubble located at the top and the bottom of the graphic to show low and high, and the median norm score for each dimension is noted with a shaded line and numeric score bubble showing where the norm score sits now based on the new population.
As before, you can still see the word descriptor associated with your score highlighted by the white rectangle, but we’ve also added your graph to the bottom of the page, so you don’t have to look back to compare your scores and ranking!
Be sure to take a moment to check out the Important Details at the bottom of the page to get clarity on these new pieces.
While this is not a part of the newest update, we’d like to take a moment to remind you of the most recent adjustment to the Motivators rankings that was announced at the end of July 2020.
“We have updated the way we score the rankings in the Motivators assessment. Originally, we had the rankings as the distance from the norm. After looking at the most common applications in practice for our clients, we believe that the ranking is actually more helpful to examine in relation to the 50% score for most people, rather than the norm.
Why change it from the norm? When we were measuring from the norm, we were using that score as a basis of comparison to other people. This is still a good way to look at it but can be accomplished with the shaded box and average score box plot in the graphs. For personal awareness and development, we believe it is more accurate to go from what would be the balance point for each individual, rather than basing it on comparison with others. That way, it expresses more precisely how each of us is driven as individuals.”
As a global leader in the field of assessment technology, we continually seek to improve upon every feature of our assessments. As always, should you have any questions or need any additional information or clarification, we are here to help. Please let us know how we can support you in your continued success.
For 20+ years, we have provided consultants, coaches, and corporations the tools to optimize hiring processes and maximize performance. Our validated assessments, flexible platform, and exceptional support have positioned us as a "Global Leader in Assessment Technology."